Expected Sales Forecast Report
The Expected Sales Forecast Report consolidates sales forecasts from the Expected Sales documents into a clear, actionable format for business users. It provides visibility into Committed, rolling, and annual forecasts to support production and procurement decisions.
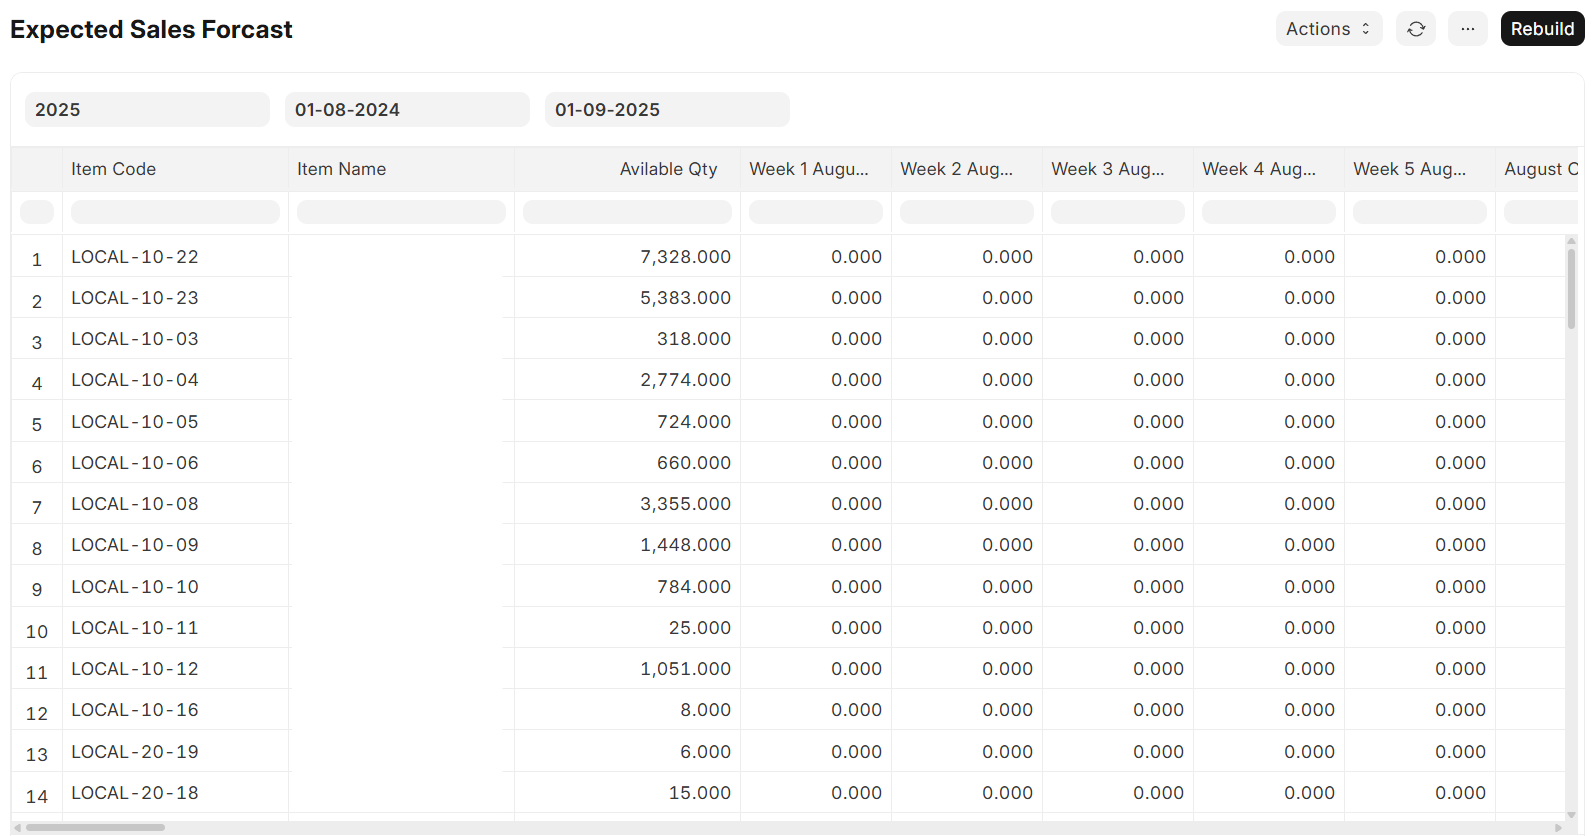
Report Columns
- Item Code – Unique identifier of the final product.
- Item Name – Product name.
- Available Qty – Current available stock in warehouse(s).
- Week 1 Committed – Demand for week 1 of the selected month.
- Week 2 Committed – Demand for week 2 of the selected month.
- Week 3 Committed – Demand for week 3 of the selected month.
- Week 4 Committed – Demand for week 4 of the selected month.
- Week 5 Committed – Demand for week 5 (if applicable).
- Committed (Sum) – Total demand for the month (sum of Weeks 1–5).
- Rolling – Forecasted demand (Rolling plan).
- Annual – Forecasted demand (Annual plan).
- Monthly Column (e.g., February, March, etc.)
- Logic:
- Takes Committed if available.
- If not → uses Rolling.
- If not → uses Annual.
- Logic:
Report Logic
- Consolidates all Expected Sales entries.
- Prioritizes Committed → Rolling → Annual when populating monthly demand.
- Helps compare Available Qty vs. Expected Demand to identify shortages.
Business Value
- Provides visibility of demand across weeks and months.
- Allows supply chain teams to track which forecast source (Committed, Rolling, Annual) is driving demand.
- Acts as the main demand input for Adjusting Stock Projected Qty Report.
